Known Issues
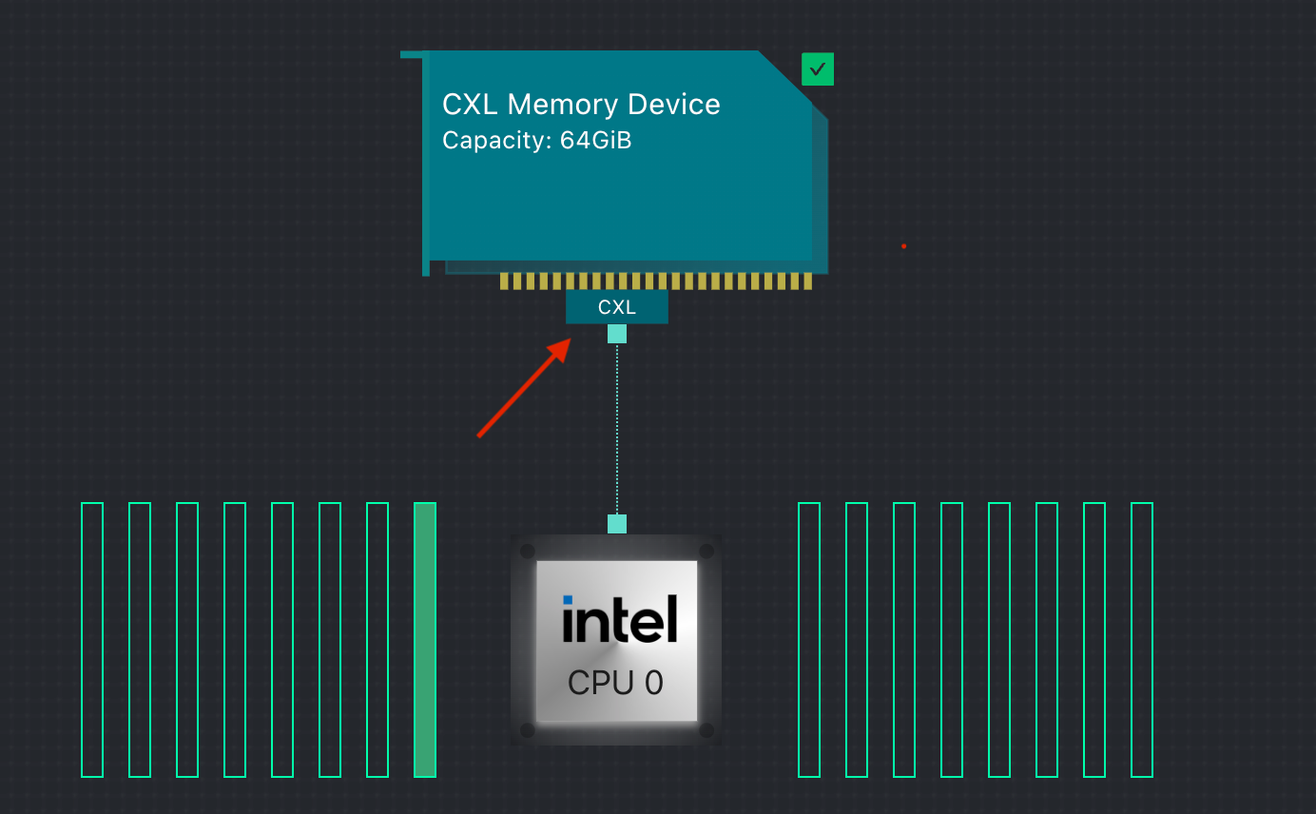
The CXL link in the System Topology view doesn't show the link speed/width.
In the system topology view, the CPU and CXL Device link may show only 'CXL' rather than '[x4|x8|x16] CXL', for example.
Cause
The cxl_pci Linux Driver doesn't return the link speed/width information.
Workaround
Use the custom topology JSON file described in section 4.0 to specify the LinkSpeed in the user.
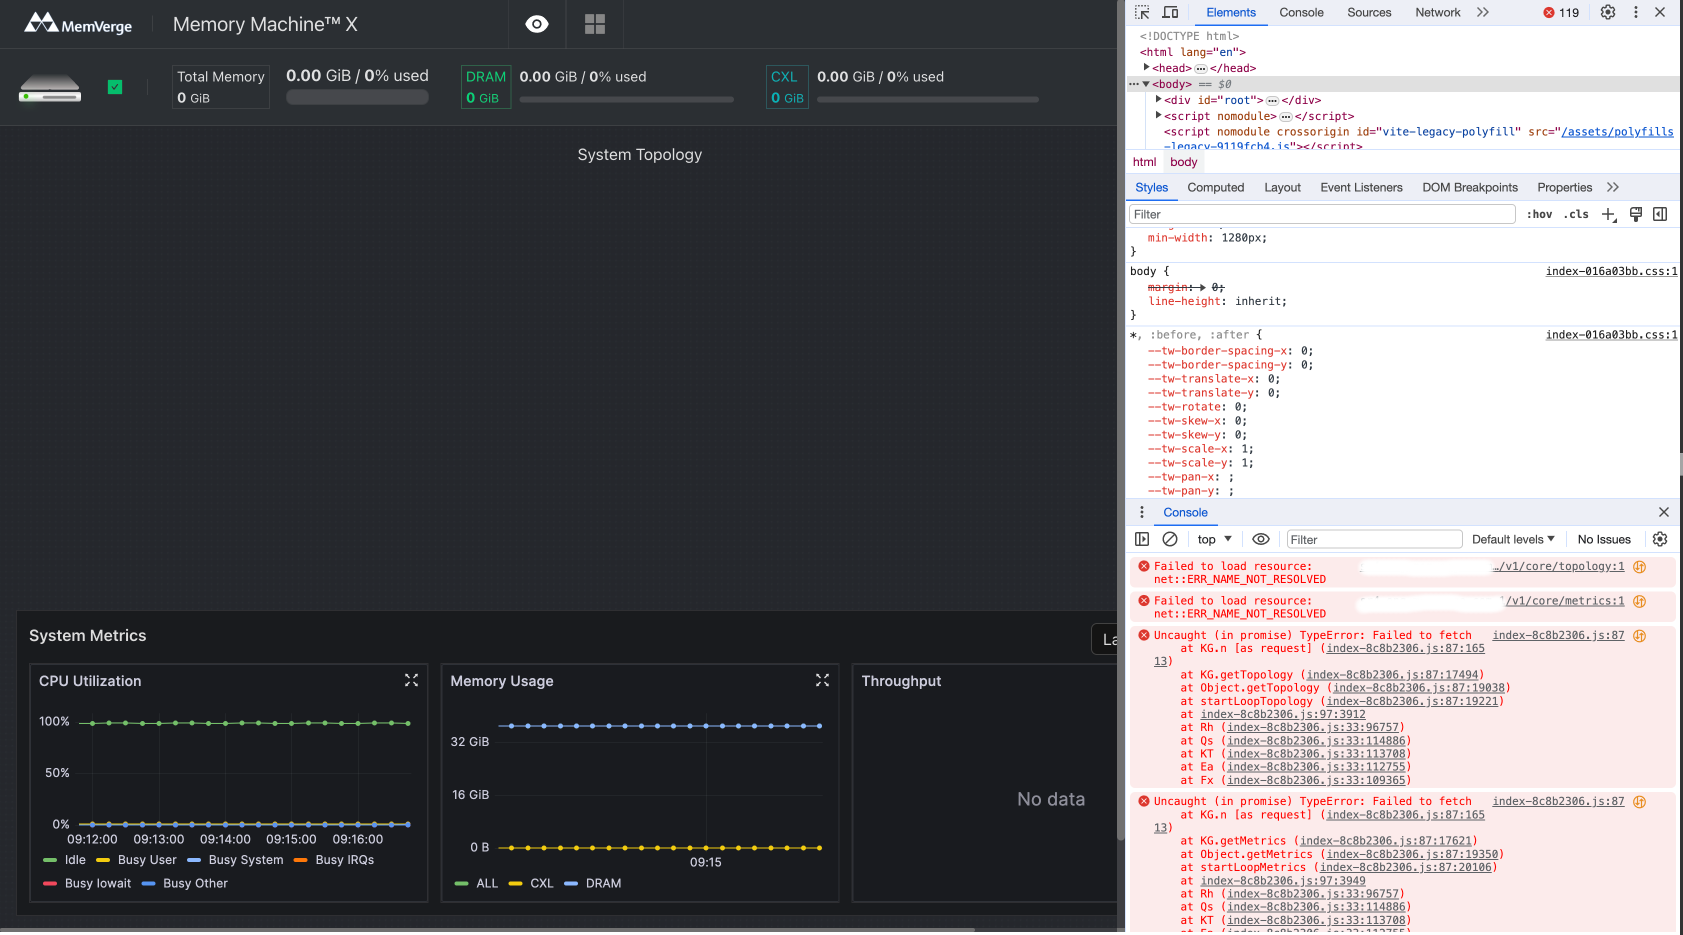
The System Topology view may be blank when the hostname cannot be resolved.
In situations where the UI does not show any system topology, open the Inspector and look at the Console in a Chrome or Edge web browser. You may see errors similar to "Failed to load resource
Cause
The issue is caused by a DNS failure to resolve the hostname to an IP address. This may happen when the host or connecting system (laptop/desktop) is not on a network.
Workaround
Use the IP address in the browser bar instead of the hostname. For example: http://<ip-address>:8080
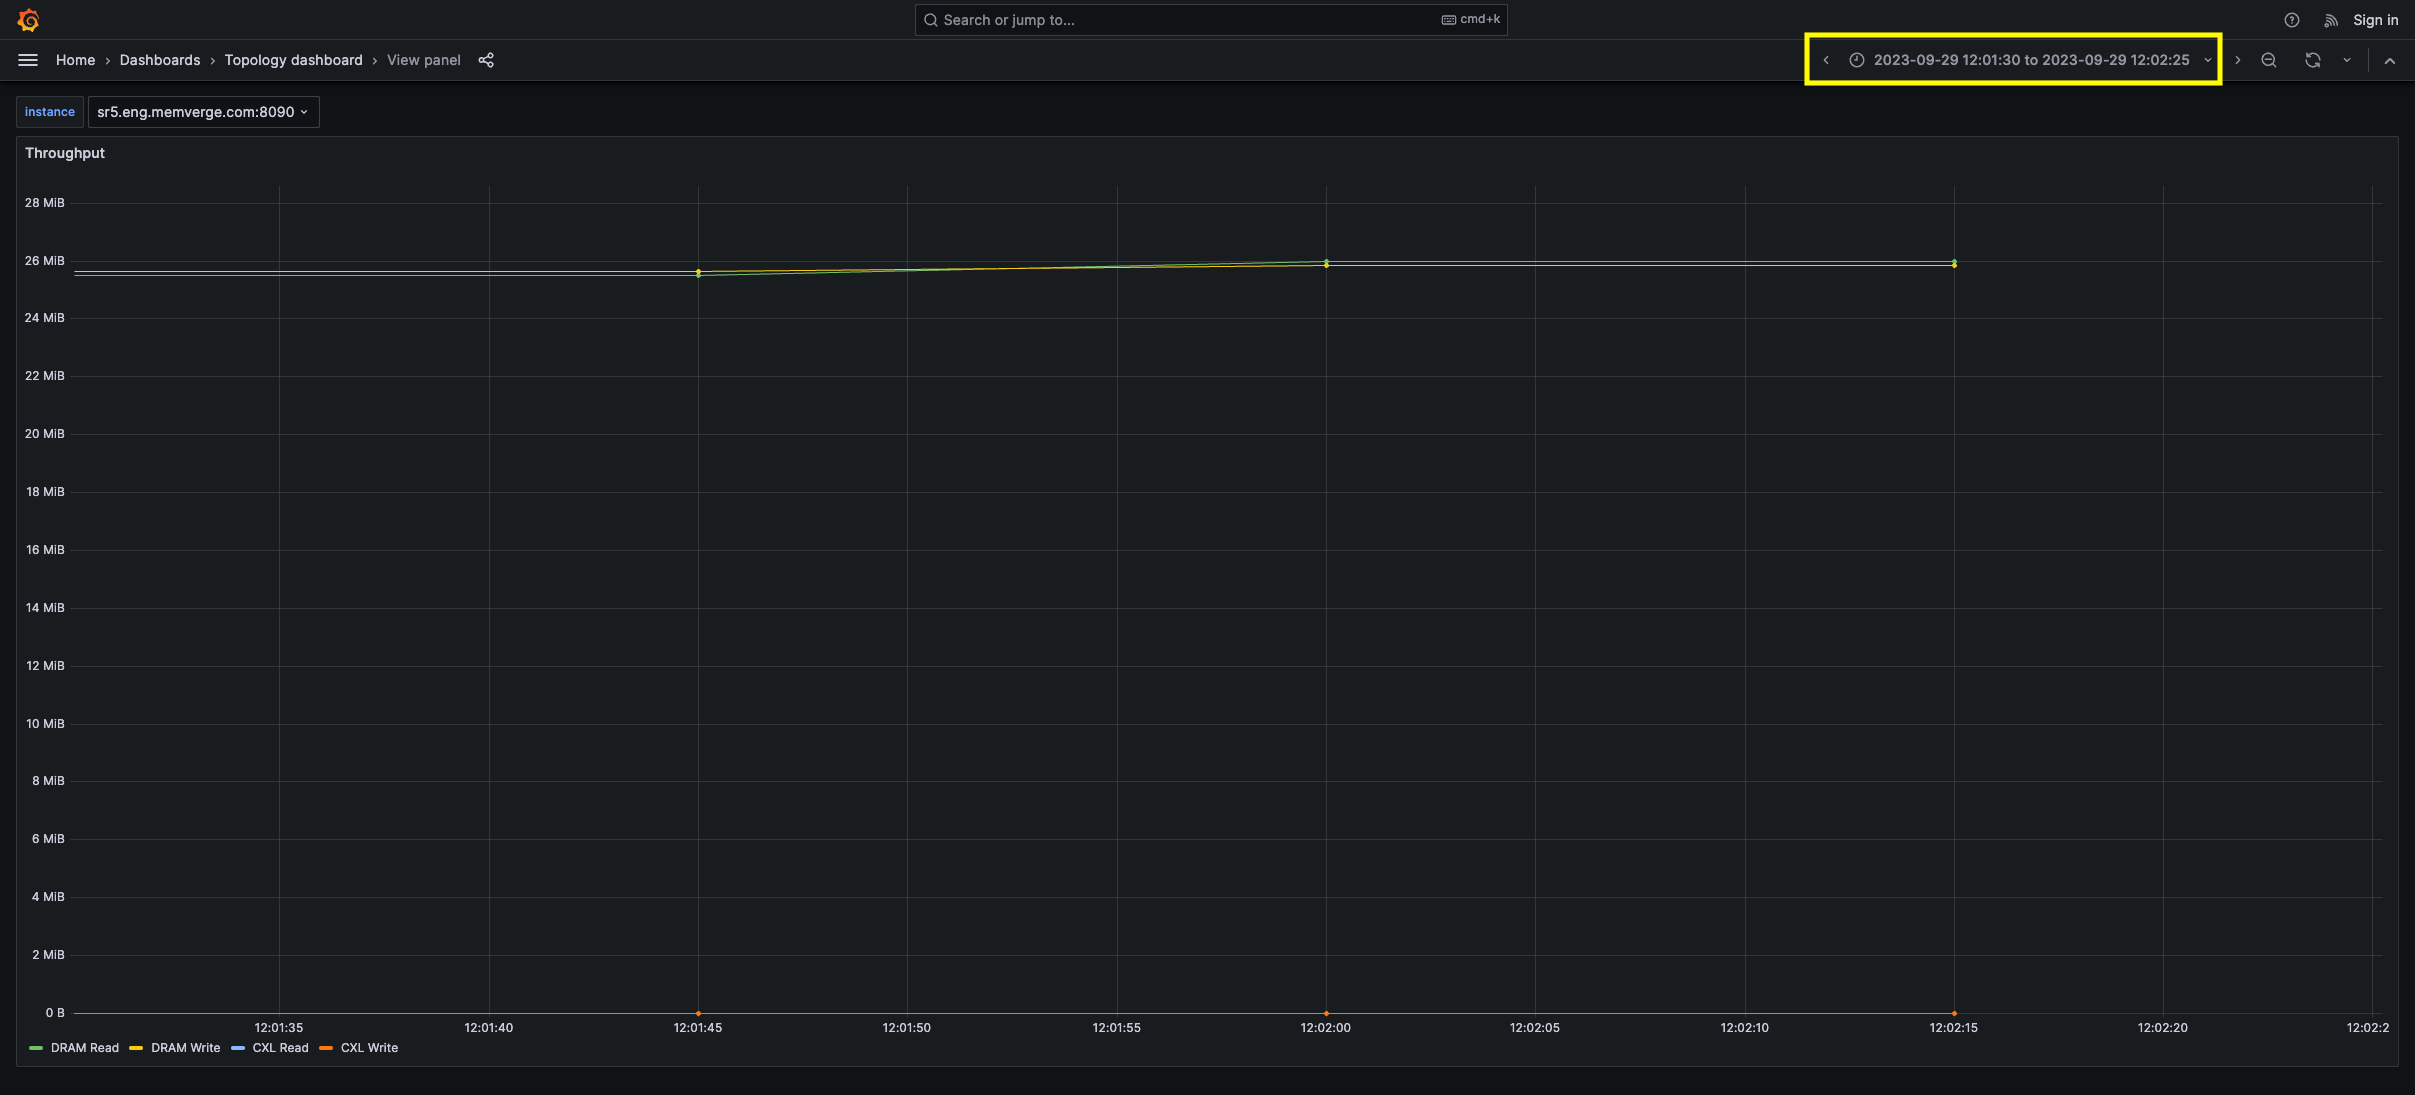
Zooming into a Chart may not show any new updates
To zoom in, a user may select a time region in any of the charts. Doing so fixes the start and end date/time range so the chart won't auto-update. The date/time range is displayed in the upper right of the chart, as shown in the following screenshot.
Cause
The start and end date/time are fixed to the selected range when zooming in. The chart will not update in this mode.
Workaround
Select a new date range from the date/time drop-down such as "Last 5mins". Alternatively, close the tab, return to the main Memory View interface window, and select the chart again.
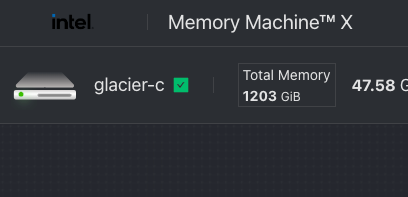
The custom company logo is difficult to see
A dark custom company logo may be difficult to see on the default dark background that Memory Viewer uses. An example is shown in the following screenshot.
Cause
Dark colors do not work well with the dark background that Memory Viewer uses.
Workaround
Use a white or light version of the company logo for better contrast.
After a system reboot or power cycle, the System Topology no longer shows any CXL devices.
Cause
Type 3 CXL.mem devices are label-less, meaning there are no persistent media on which to write the labels in the Label Storage Area on the CXL device itself. A system reboot or power cycle returns the device to the system defaults.
Workaround
Write an init.d script or systemd.unit service to run the command(s) to configure the CXL devices to your required configuration. For example, to manually convert all CXL devices to 'system-ram' mode and have them appear as memory-only NUMA nodes in numactl -H, run:
DRAM and CXL Used reports higher than application memory used
Cause
The used values shows for DRAM and CXL include memory allocated by applications and buffers and caches used by the Kernel. All NUMA node values are summed using the Memory Total and Memory Used values in /sys/devices/system/node/node[0-9*]/meminfo. The memory summary values reported by Memory Viewer may be inflated due to the inclusion of buffers and caches within these calculations.
Workaround
None
Resolution
A future release of Memory Viewer will report memory usage and buffer cache usage separately to make this clearer.
The Memory Throughput charts show inflated values for DRAM on Intel and AMD platforms
Cause
The throughput charts for DRAM read and writes include CPU L1, L2, and L3 cache hits.
Workaround
None
Resolution
The CPU Cache hit throughputs will be displayed separately in a future product release.
The Application Hot Memory Chart has gaps
The Hot Memory chart for a profiled application may show gaps.
Workaround
None
Resolution
This issue will be fixed in a future product release.
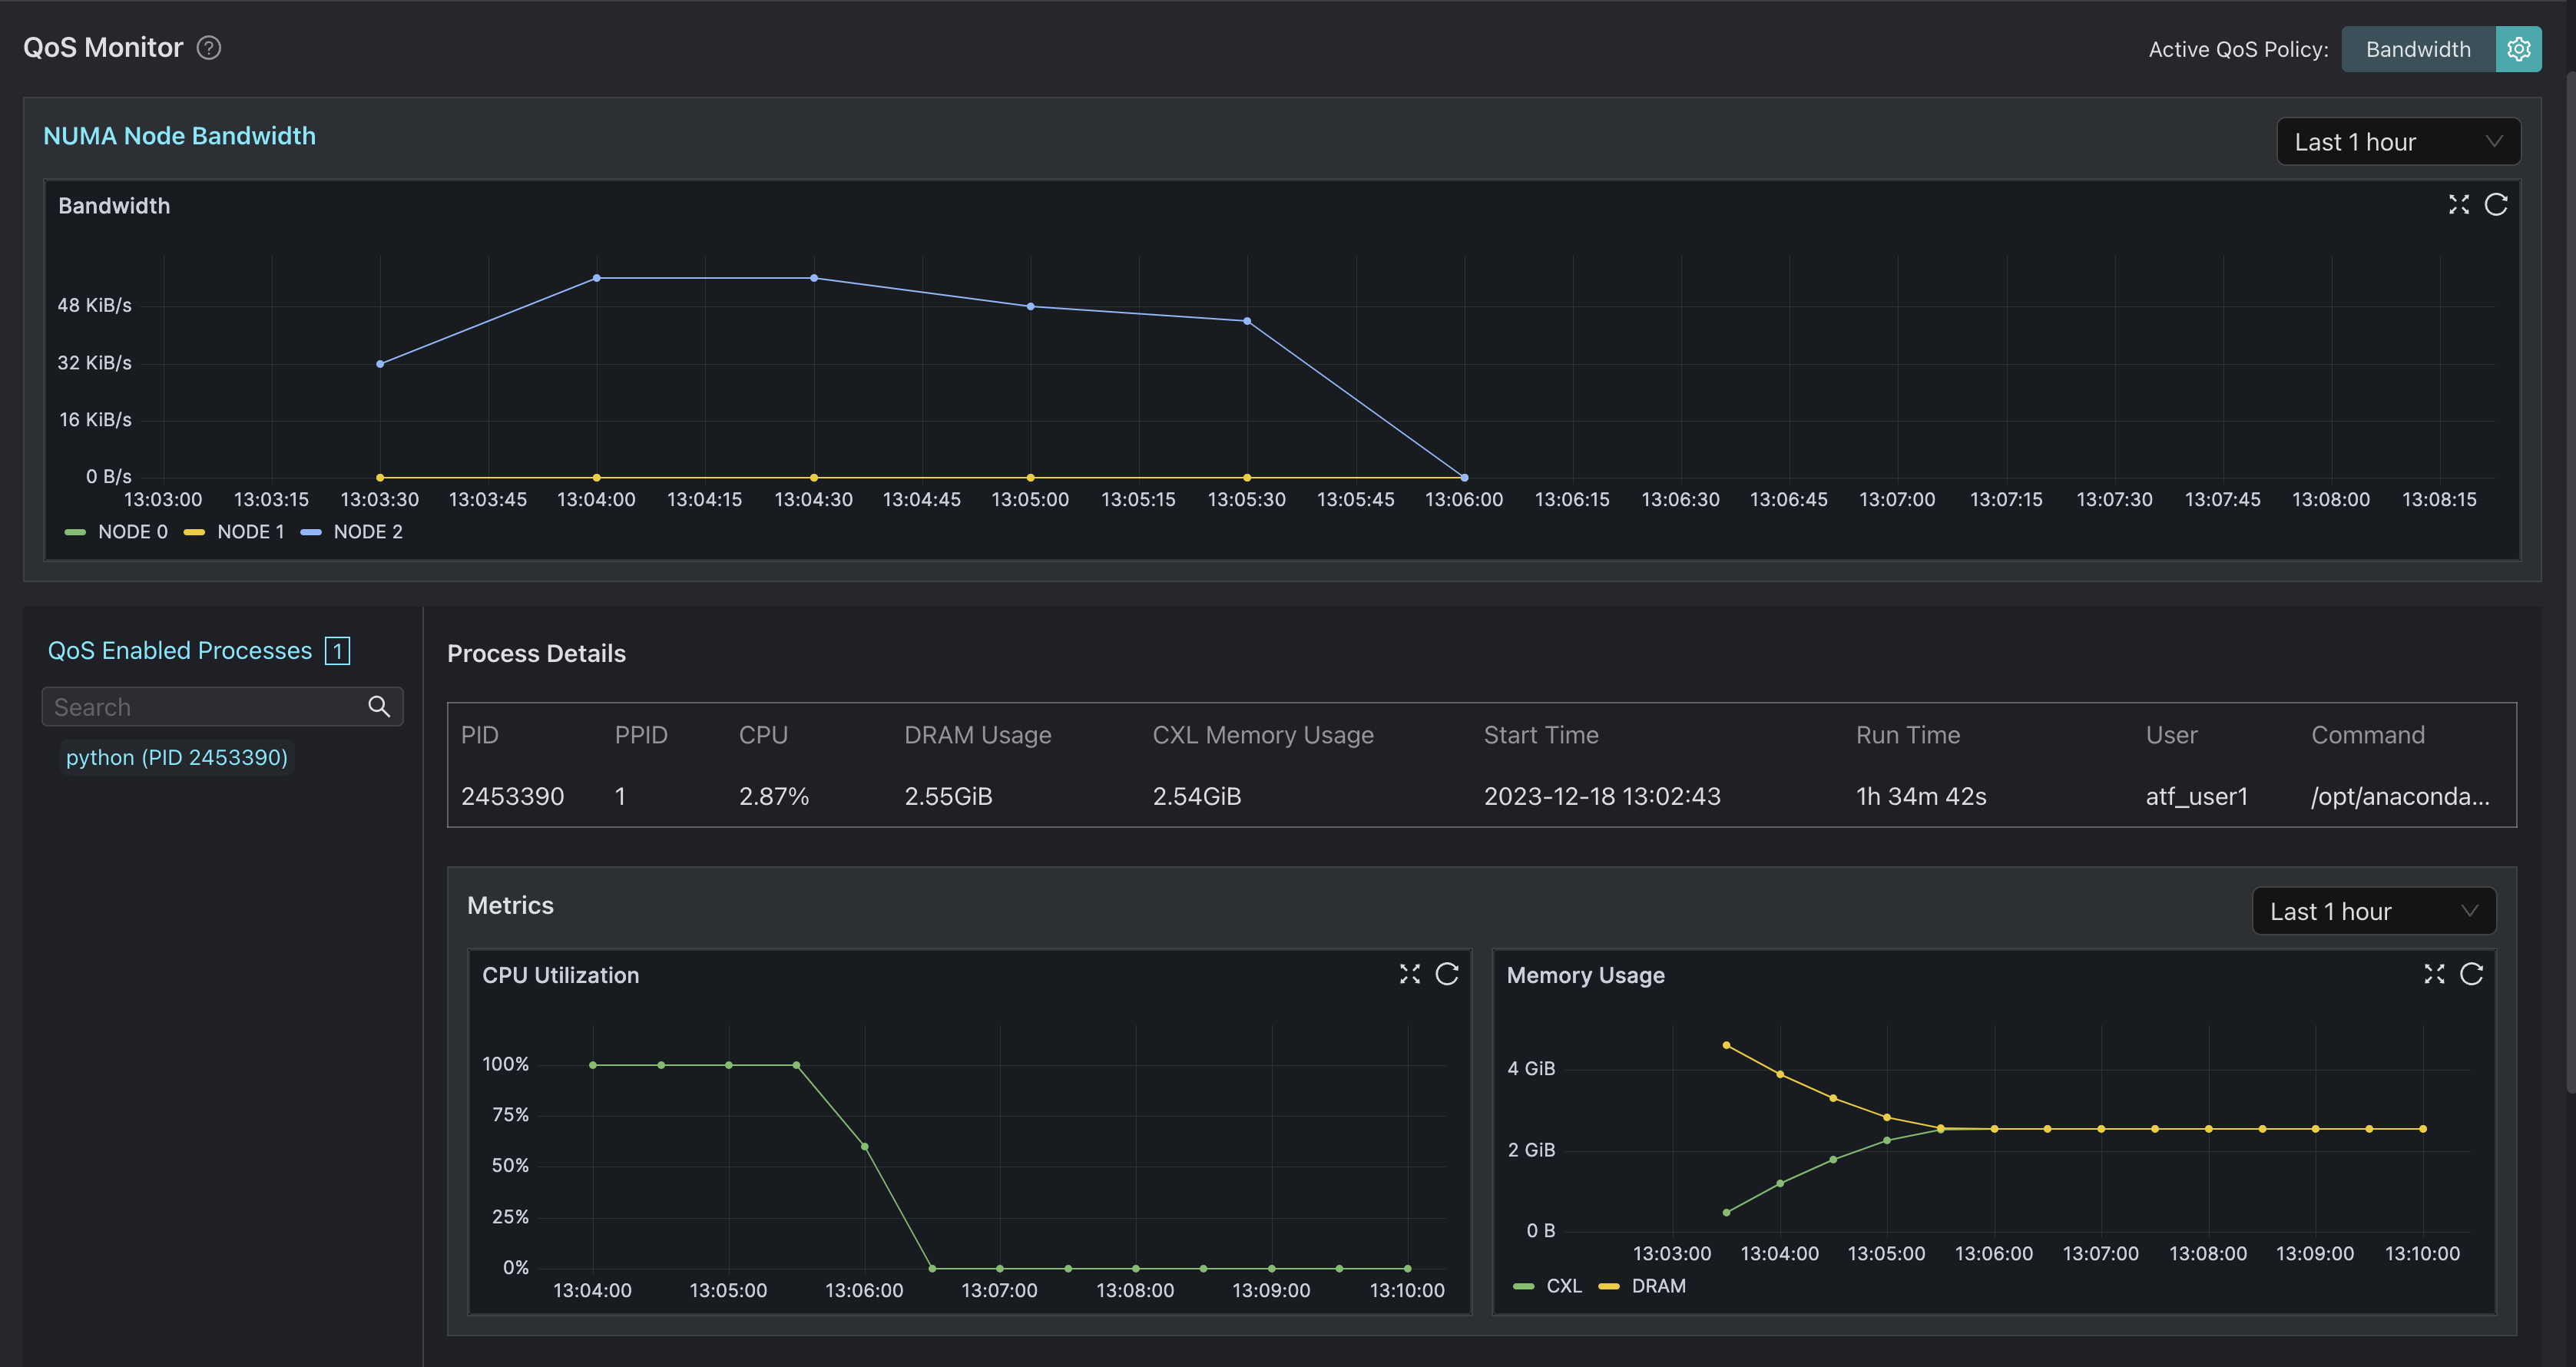
The QoS NUMA Node Bandwidth chart is lower than the total KB/sec moved.
Suppose a process allocated 5GB on DRAM with a bandwidth ratio of 0.5. The test total time is 165 seconds for the migration to reach the 0.5 DRAM/CXL ratio. We should have an average of 16MB/second moved from the calculation. However, the chart shows an average of about 48KB/second moved. For example:
Cause:
The issue is caused when Large, Huge, or Transparent Huge Pages are used.
Workaround:
None
Solution:
This issue will be resolved in a future release when Large, Huge, and Transparent Huge Pages are supported.
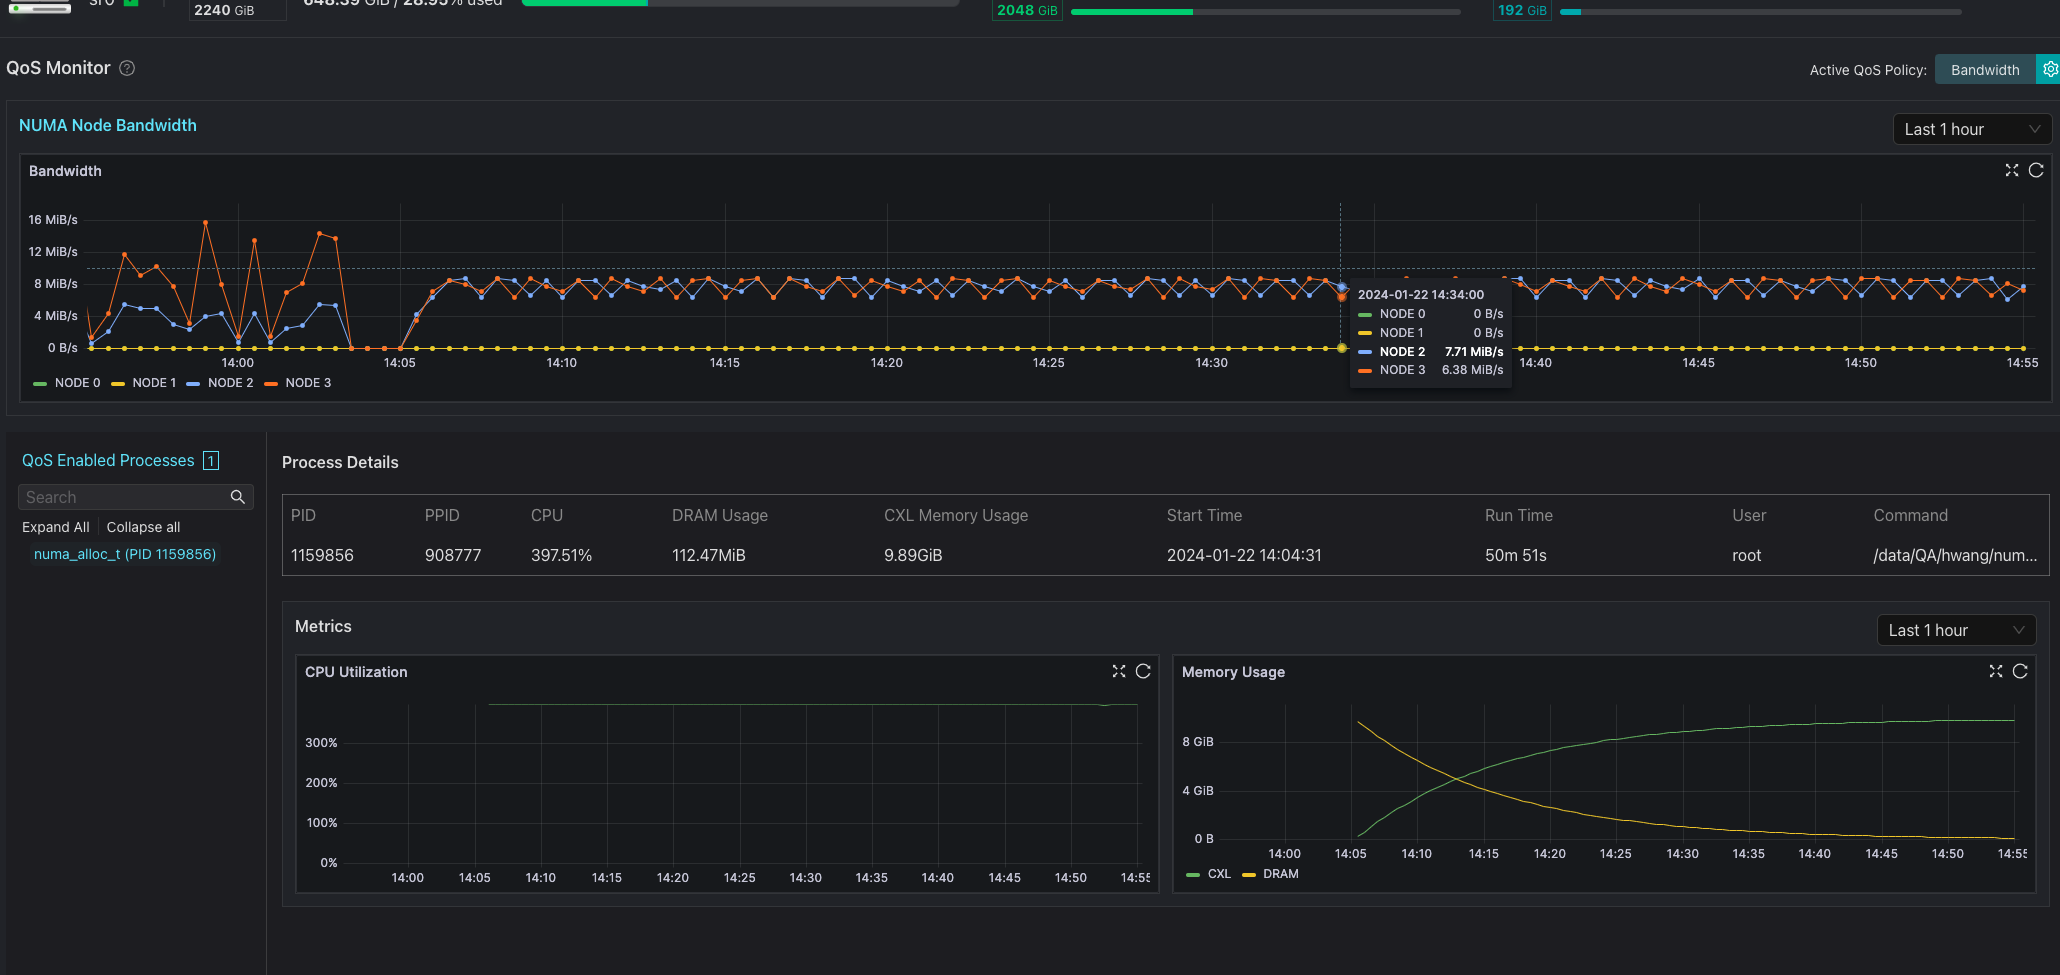
The Memory Usage chart may show more usage than actual.
Issue:
An application may spawn multiple child processes. For example a parent process spawns 200 processes that allocate 1GB of memory. The Memory Usage chart show almost double the actual usage at some points in time. For example:

Cause:
The information is acquired using numastat for each NUMA node. The Linux Kernel doesn't break out if the memory is used or in caches or buffers, so the memory is double counted, which causes inconsistencies in the UI charts.
Workaround:
None
Solution:
A future release will address this issue, but it relies on acquiring accurate NUMA stats from the Linux Kernel, which isn't possible to date.
The Page Move Rate Graph may be Inconsistent with the Memory Usage Graph
Issue:
In certain situations, the 'Page Move Rate' chart may be inconsistent with the 'Memory Usage' chart. For example, if an application uses 10GB of DRAM and a bandwidth ratio of 0:100, the expectation would be to observe 10GB in CXL over time. However, this may never be reached, as shown in the following chart example:
Cause:
Due to the fact that pages are chosen at random, the number of correctly chosen pages diminished over time.
Workaround:
None
Solution:
A future release will address this issue.
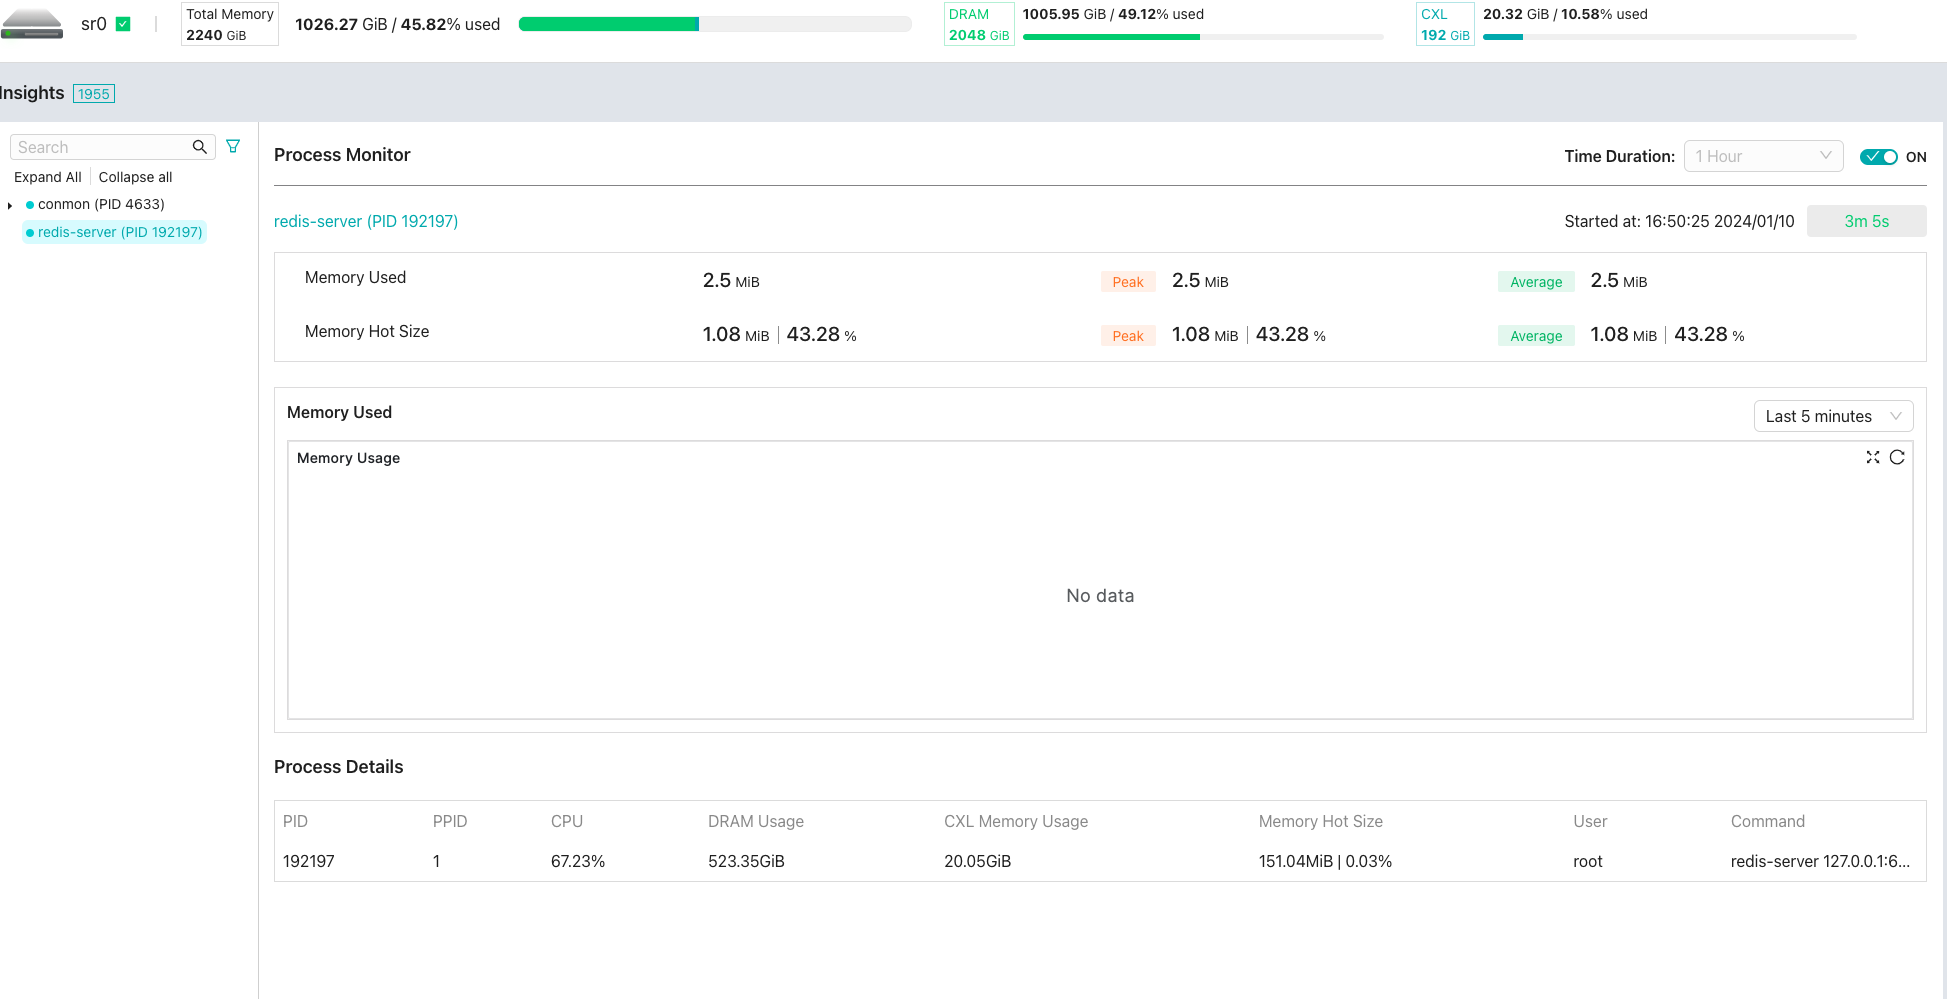
The Insights Results Chart may show 'No Data' or Gaps in the Chart.
Issue:
If this issue is encountered, the working set size charts may not return any information, or there may be gaps in the chart. An example may look similar to the following:
Cause:
The data is collected by numastat, which can take longer than the timeout to execute and return data. If numastat times out, no data is returned. This is a symptom of the Kernel memory locking mechanism and what the system and application are doing or having done to it. Memory Machine implements a Timeout mechanism to avoid causing a numastat storm on the system. However, this doesn't fully resolve the issue of numastat not executing within the timeout value.
Workaround:
None.
Solution:
This issue will be resolved in a future release.