Dashboard Overview
The Dashboard view provides a high-level overview of your Memory Machine Batch operations, offering quick insights into job progress, resource utilization, and cost savings.
Let's break down each section of the Dashboard View and describe what valuable information each provides.
Dashboard Header

At the top of the dashboard, you'll find:
- Memory Machine Batch Title: Identifies the product.
- Dashboard / Jobs Tabs: Allows you to navigate between the main Dashboard overview and the detailed Jobs list.
- Version: Notes which version of MMBatch you are currently running. In the image above, it is '1.4.2-alpha.6'
- User Menu Icons: Provides access to user settings, notifications, and other account-related functions.
- Date Range Filter: Click the calendar icon to select a custom start and end date for the data displayed on the dashboard.
- Refresh Button: Click this to update the dashboard with the latest data.
Let's take a closer look at the User Menu Icons, as each is powerful and has unique benefits:
Configuration Icon

Although small, this icon houses all configuration capabilities within the Management Server. Once clicked, it will provide you with five separate areas for configuration.
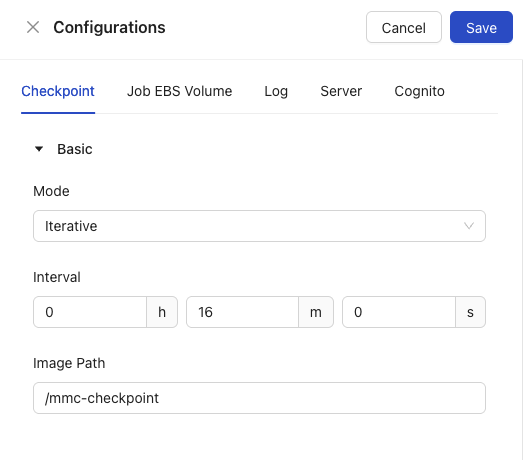
Note
The Cancel and Save buttons on the top right of the Configurations View are key to this part of the Management Server. Any changes made in any of the five configuration areas will need to be saved by clicking on the blue Save button.
The default view is of the Checkpoint configuration area.
Checkpoint
Users can enable / disable checkpointing for spot reclaim protection, as well as configure the interval between checkpointing. Check out our Configuration Guide.
Checkpoint is divided into two sections, Basic and Advanced:
Basic Section:
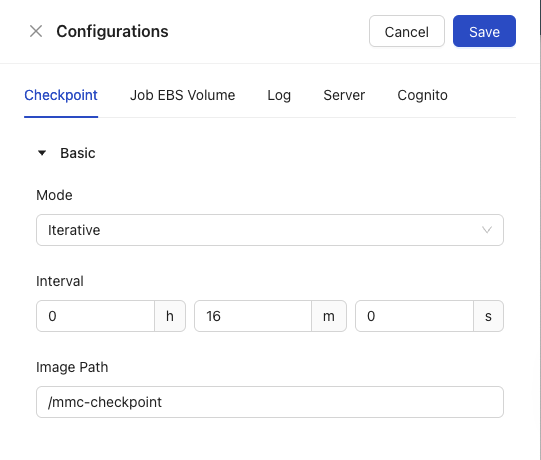
Within the Basic Section you will find the following configuration options:
- Mode: Choose between None, Iterative, and Periodic
- Interval: Choose the interval you wish to have by hours, minutes, and seconds.
- Image Path: Choose which image you want Management Server to point to.
Advanced Section:
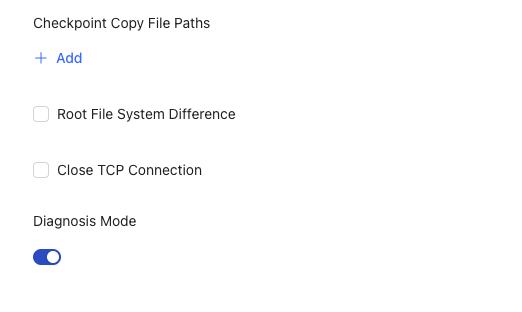
Within the Advanced Section you will find the following configuration options:
- Checkpoint Copy File Paths: Add Checkpoint copy file paths here
- Root File System Difference: Click this checkbox if you wish to see differences in root file systems.
- Close TCP Connection: Click this checkbox if you wish to close the TCP connection.
- Diagnosis Mode: Toggle this switch if you wish to be in Diagnosis mode for error detection and troubleshooting activities.
Job EBS Volume
Users can enable or disable managed EBS features, as well as configure the EBS volume type, size, mount path, and custom tags.
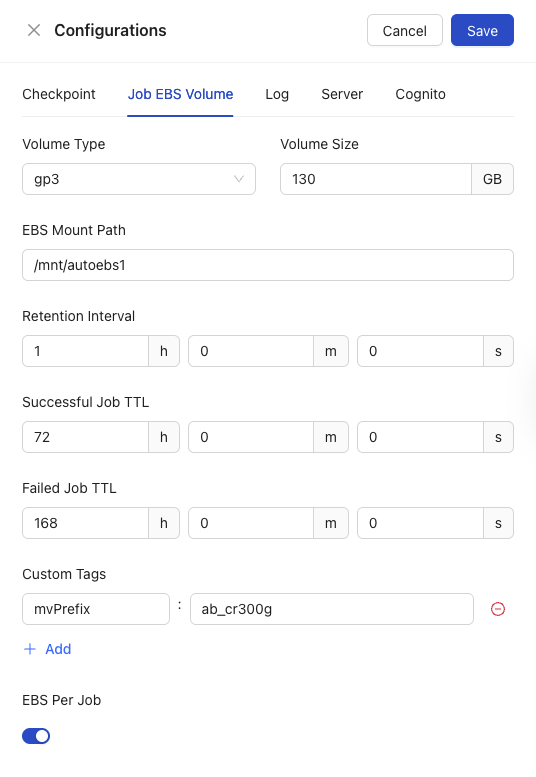
- Volume Type: MMBatch offers seven different options via a dropdown menu to best fit the type of volume you have:
- General Purpose SSD (gp3, gp2)
- Provisioned IOPS SSD (io2, io1)
- Throughput Optimized HDD (st1)
- Cold HDD (sc1)
- Magnetic/Previous Generation (standard)
- Volume Size: Choose which size of volume you have within EBS.
- EBS Mount Path: Add the mount path you have for EBS
- Retention Interval: Choose which interval you wish to retain data for.
- Successful Job TTL: Set the duration for which the EBS Volume (and the data on it) associated with a successfully completed batch job will persist before being automatically deleted or de-provisioned.
- Failed Job TTL: Set the duration for which the EBS Volume (and the data on it) associated with a failed batch job will persist before being automatically deleted or de-provisioned.
- Custom Tags: Set custom tags to match custom tags for AWS Cost Explorer.
- EBS Per Job: Enable or disable by toggling the switch.
Space Considerations for using Managed EBS
During restore when using Managed EBS, the new instance must first do a docker pull of the container image. As the docker image is saved to the root volume, it must be large enough to hold the image. For large containers, such as for GPU workloads, the additional docker pull increases the time required to perform checkpoint-restore by 5-10 minutes, as measured with a 45GB image. Managed EBS will not use space in the root volume for application data.
Log
The Log area allows for configuration of logging associated with MMBatch jobs.
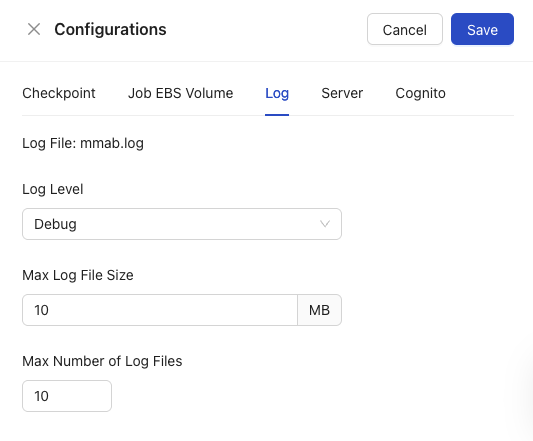
- Log File: This field is not editable and reports the name of the log file.
- Log Level: Log files record application events, categorized by levels that indicate severity or detail. This helps you understand system behavior and troubleshoot. Select the logging level you wish to report to your log file from a dropdown of five options:
- Error: Critical issue preventing an operation or function. Indicates a serious failure requiring immediate attention.
- Warning: An unexpected event or potential problem. The application continues, but this might lead to future issues.
- Info: General, high-level messages about normal application progress and significant events.
- Debug: Detailed internal information for developers or advanced troubleshooting. Can be very verbose.
- Trace: Extremely fine-grained details for deep diagnostics. The most verbose level, often impacting performance.
Server
The server configuration area allows users to establish access adresses and enter certificate and private key paths.
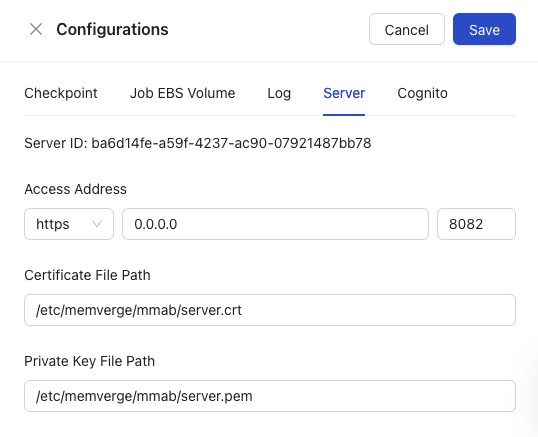
- Server ID: this non-editable field displays your Server UUID.
- Access Address: within this area you can set a network address, http type, and port should you choose not to use the default settings.
- Certificate File Path: the location (address) on your computer or server's file system where a digital certificate file is stored. Software uses this path to find and access the certificate, which is essential for secure communication, authentication, or encryption processes.
- Private Key File Path: the location (address) on your computer or server's file system where a private key file is stored. Software uses this path to find and access the private key, which is essential for secure communication, authentication, or encryption processes.
- Engineering Mode: Toggling this switch to "on" or "blue" and hitting the configuration save button will enable engineering mode, which changes the dashboard view to show additional information regarding EC2 spot savings.
Cognito
The Cognito configuration area allows users to utilize existing AWS Cognito credentials to sign in MMBatch’s Management Server. Check out our Guide for how to enable, disable, and sign in to Cognito.
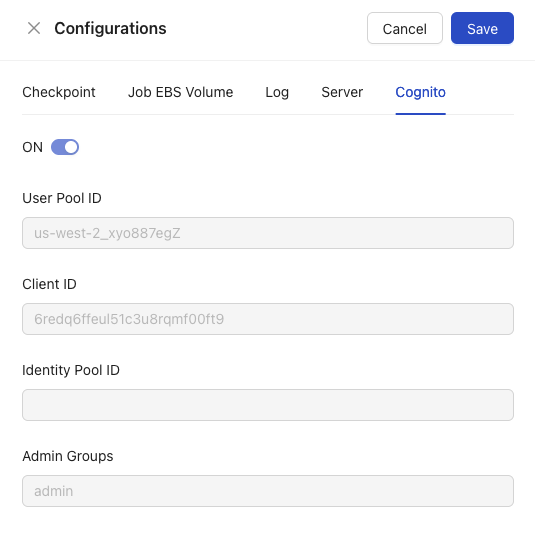
- ON Toggle: This toggle shows that Cognito is currently On.
- User Pool ID: This ID uniquely identifies that specific user directory within your AWS account and a particular AWS region.
- Client ID: The entity that is authorized to call the Amazon Cognito User Pool API operations.
- Identity Pool ID: A component of Amazon Cognito that allows your users to obtain temporary AWS credentials to access AWS services directly.
- Admin Groups: Any administration group associated with this AWS Cognito configuration.
Important Note on Cognito
If you have Cognito enabled, please be aware that users may have to reauthorize in order to download log bundle files. This means if a user wants to download files with wget or with curl, they need to pass a token for authorization within Cognito.
Download System Logs 
This icon, when clicked, will download all system logs (you can decide how much or little you desire using the Log section of the Configuration Icon). The file will be compressed, will hold all files within it, and will hold the name of your log file (mmab.logs in this case):

Light/Dark Mode 
The Light/Dark Mode icon allows you to choose if you wish to view the Management Server in Light mode or in Dark Mode. If you are viewing in Dark mode, the icon will change to ![]() .
.
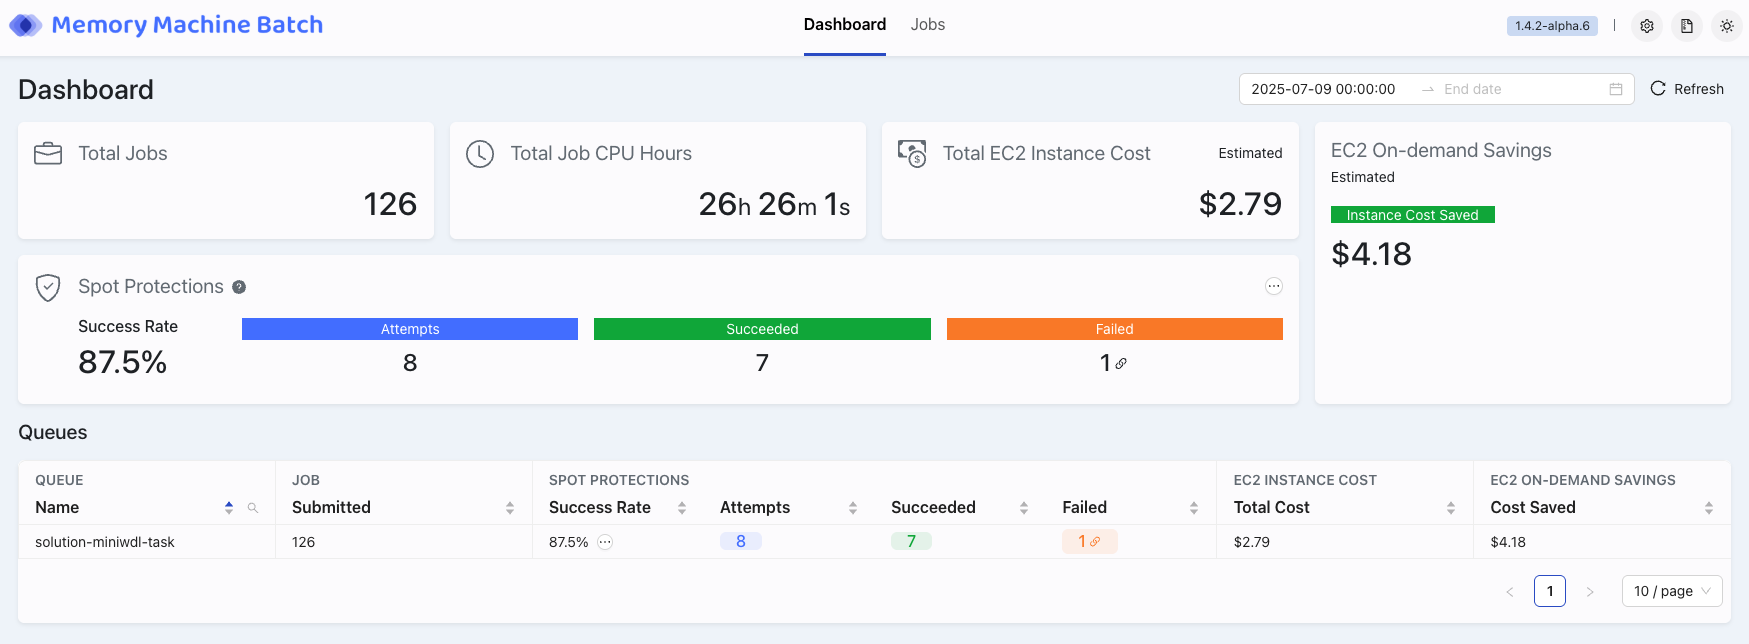
Summary Information
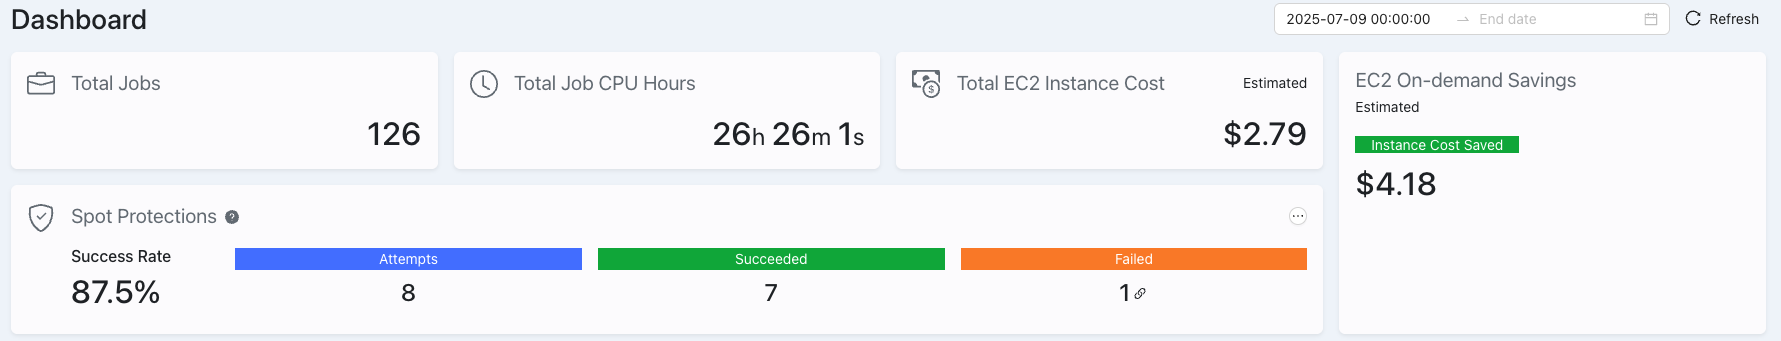
The section beneath the header, specific to Dashboard, features several critical summary metrics:
- Total Jobs: The total number of AWS Batch jobs submitted with MMBatch installed and enabled that have been processed within the selected date range.
-
Total Job CPU Hours: The cumulative CPU hours consumed by all AWS Batch jobs submitted with MMBatch installed and enabled. It is based on the amount of CPU time requested, not the actual CPU usage. The CPU hours of an individual job is computed as follows:
The runtime of an individual job is computed as follows: -
Total EC2 Instance Cost (Estimated): An estimated total cost of the EC2 instances used for all MMBatch jobs.
- EC2 On-demand Savings (Estimated): Estimated cost savings from EC2 when replacing on-demand instances with spot instances for the jobs within MMBatch.
-
Spot Protections: The number of jobs that utilized Spot Protection, preventing interruptions. Spot Protections involve checkpointing (saving state) and restoring (recovering state). A protection is counted only when the restore succeeds.
- Success Rate: The percentage, or rate of success of checkpoints for all queues within MMBatch. Looking at the data in the image above, we see that we have 8 attempts, 7 successes, and 1 failure. Success rate is determined by the amount of restore successes divided by the number of checkpoint attempts, multiplied by 100 to provide a percentage or rate:
- Attempts: The number of checkpoint attempts made to checkpoint for all queues managed within MMBatch.
- Succeeded: The number of successful restores for all queues managed within MMBatch.
- Failed: The number of checkpoint attempts minus the number of restores succeeded for all queues managed within MMBatch. Notice how the "Failed" area has a small chain link icon (
 ) adjacent to the reported number? You can click on that link to get to the Jobs view with a filter to search for failed jobs, so further analysis can be done.
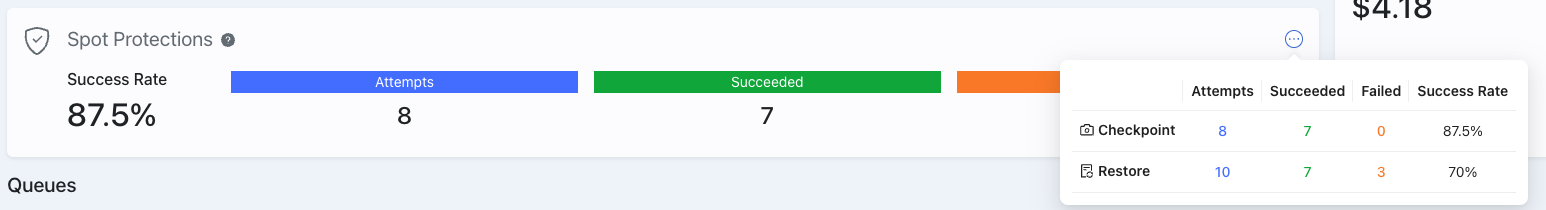
 - Ellipsis: The small elipsis icon, when hovered over, provides specific reporting on checkpoints and restores, as in the image below:
- Success Rate: The percentage, or rate of success of checkpoints for all queues within MMBatch. Looking at the data in the image above, we see that we have 8 attempts, 7 successes, and 1 failure. Success rate is determined by the amount of restore successes divided by the number of checkpoint attempts, multiplied by 100 to provide a percentage or rate:
Queue Details Table
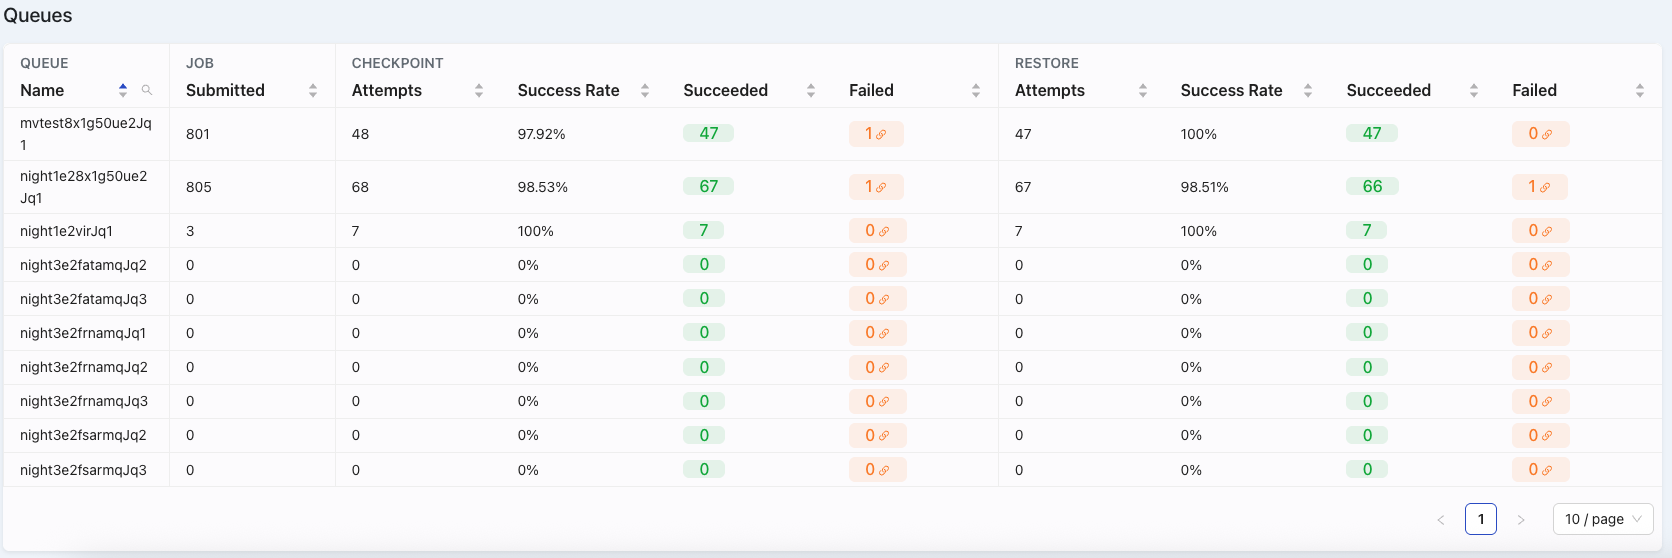
Below the summaries, a detailed table provides granular data for each of your queues:
- QUEUE Name: The identifier for each individual queue.
- JOB Submitted: Number of Jobs submitted for the given queue.
- SPOT PROTECTIONS Columns: For each queue, this section shows:
- Success Rate: The number of restore successes divided by the number of checkpoint attempts within that queue. When the mouse hovers over the ellipsis ("..."), you will be displayed with detailed information specific to checkpoints and restores identical to the view for Dashboard Summary, at the individual queue level.
- Attempts: Checkpoint attempts for jobs in that queue.
- Succeeded: The count of successful restores for jobs in the queue.
- Failed: The count of checkpoint attempts minus the restores succeeded. The chain icon () will take you to the jobs view with a filter that only looks for failed jobs.
- EC2 Instance Cost: An estimated total cost of the EC2 instances used for this queue.
- EC2 On-demand Savings: Estimated Cost saved from EC2 when replacing on-demand instances with spot instances for this specific queue.
- Pagination At the bottom right of the Queues table, pagination controls (e.g., "1 / 10 page") allow you to navigate through multiple pages of queue data if your list exceeds a single view.
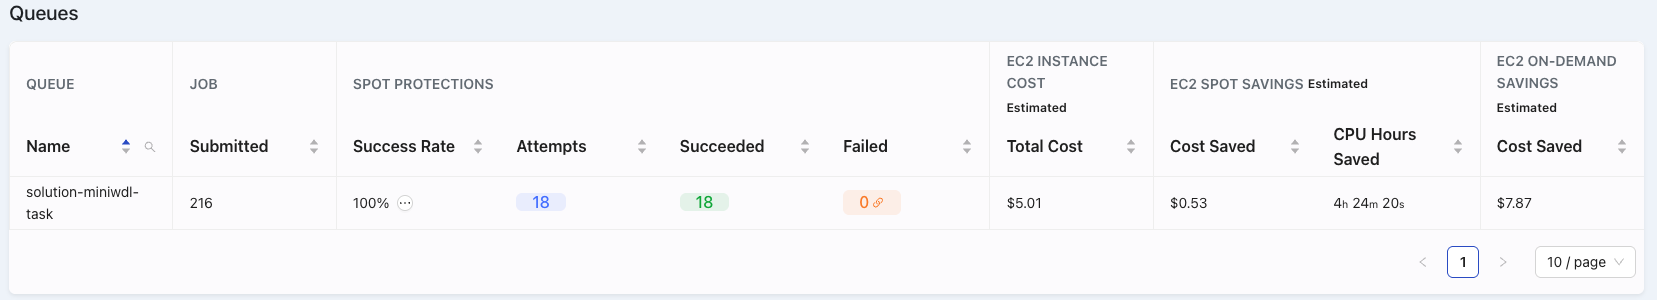
Engineering Mode View
Enable Engineering Mode by navigating to the Configuration area of the Dashboard header. Within the Server subsection, toggle the "Engineering Mode" switch to on and hit the "Save" button at the top of the Configurations setting. When this is done, your Dashboard Summary information will change to include a new tile, "EC2 Spot Savings", like below:
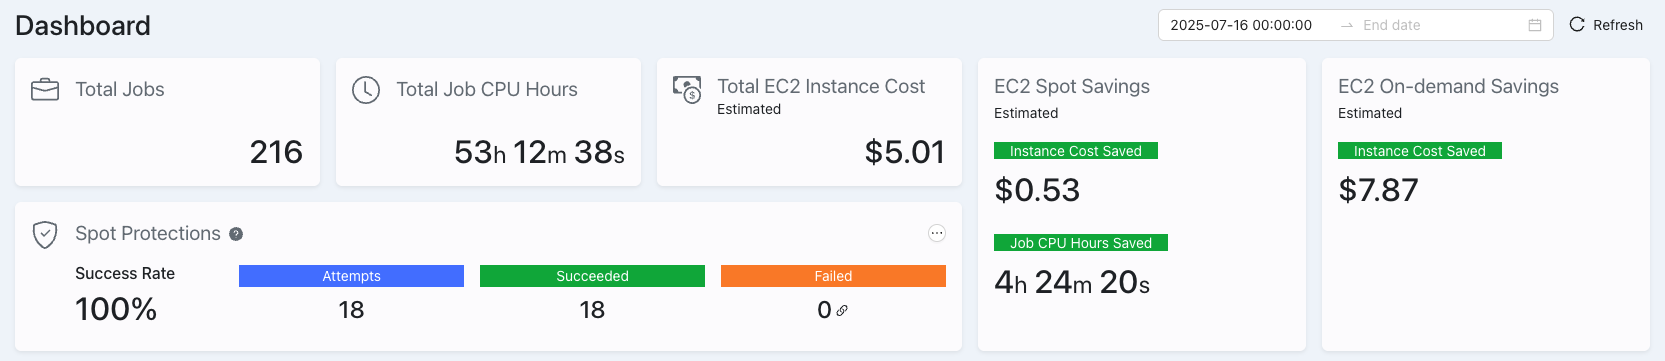
This view provides additional information on estimated savings from utilizing spot protections on both a monetary and time basis.
Engineering Mode also provides more information within the Queue Details table. It provides additional information regarding spot savings at both a monetary and time basis, as shown below: