The Hosts Console Overview Page
The Hosts Console shows a list of managed hosts and host groups, and metrics including aggregated memory usage for a selected host.
The Hosts Console is displayed when the Hosts icon is selected in the Console Selector and the Overview Tab is selected in the Hosts Main Page.
The Hosts Console shows the labeled parts of the Hosts Console Overview Page in the Memory Machine application.
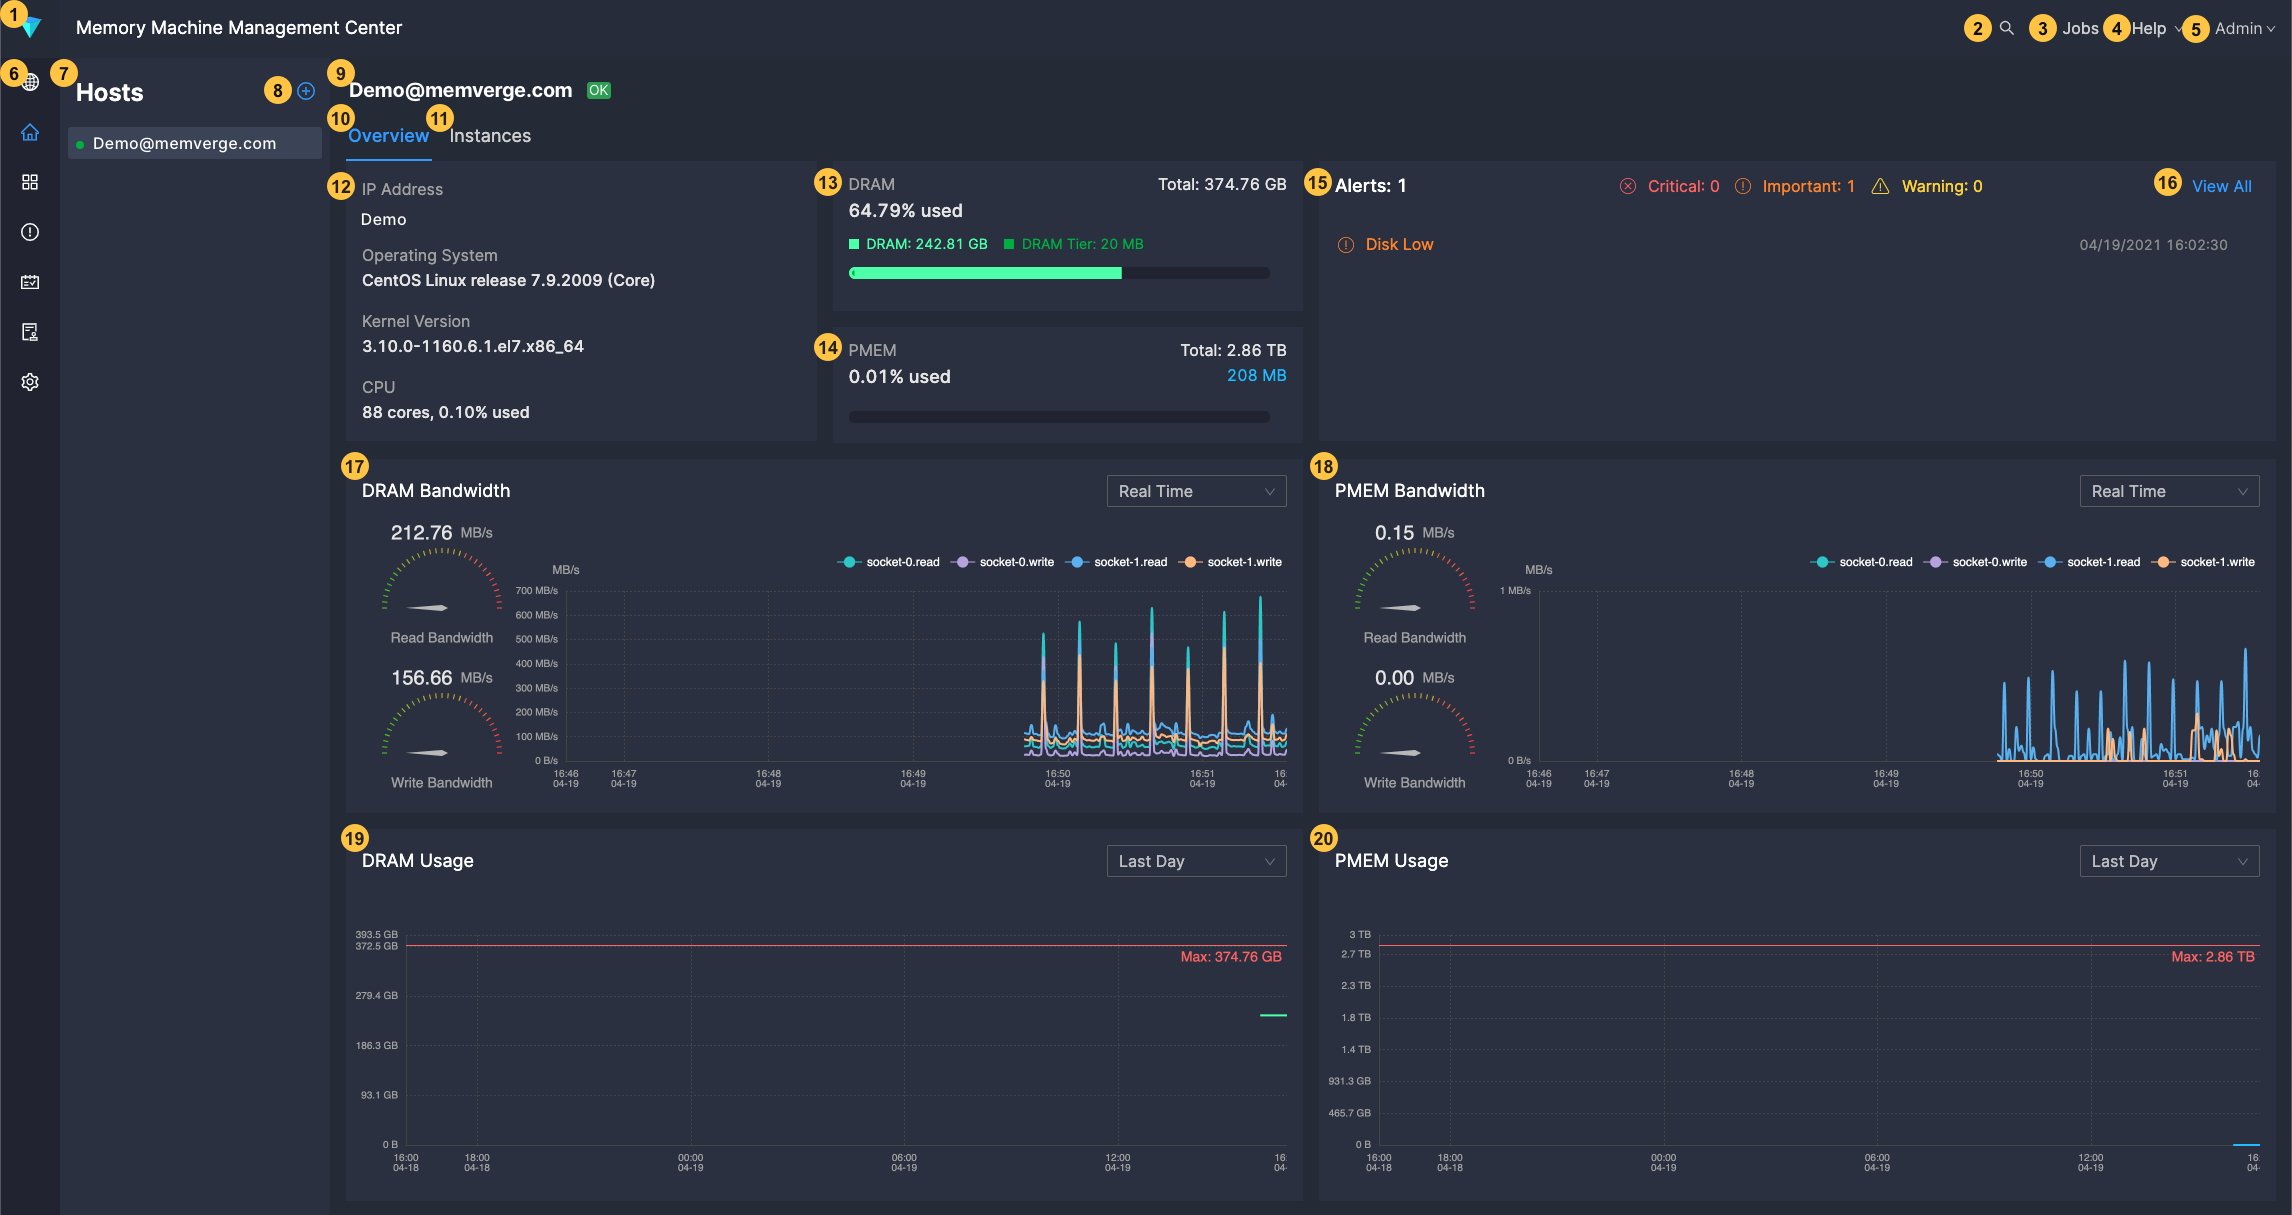
The Hosts Console Overview Page contains the following elements:
- MemVerge Application Name
- The UI application logo and name (Memory Machine Management Center).
- Global Search Icon
- Click to search for host group, host, application instance, snapshot, and cluster snapshot names.
- Jobs Dropdown
- Click to view scheduled jobs. See Viewing Jobs.
- Help Dropdown
- Click to open the Help Center, the Open API Reference, or the Memory Machine Information Pop-Up.
- User Dropdown
- Click to log the current user off the Memory Machine Management Center.
- Console Selector
- Click to choose one of: Global Dashboard, Hosts Console, Applications Console, Alerts Console, Jobs Console, Usage Report Console, or Settings Console.
- Hosts List
- Shows the hosts and host groups under management. Choose a host or host group to see details in the main window.
- Add Host Icon
- Click to add a host or to create a host group.
- Host Name
- The host name and status.
- Overview Tab
- Available for hosts but not host groups. Click to show an overview of the selected host.
- Instances Tab
- Available for hosts but not host groups. Click to show the application instances running on the selected host.
- OS Summary Panel
- The IP address, operating system name and version, and CPU specs for the selected host.
- Volatile Memory Usage Panel
- A bar graph showing volatile memory (DRAM) used as a fraction of managed DRAM capacity on the host. Mouse over the used-memory bar to see a summary of used and available HugePages.
- Persistent Memory Usage Panel
- A bar graph showing persistent memory (PMem) used as a fraction of managed PMem capacity on the host.
- Alerts Panel
- A list of the most recent alerts for this host.
- View All
- Click to go to the Alerts Console.
- DRAM Bandwidth Panel
- Contains a real-time display of DRAM read and write rates and a graph of DRAM read and write rates a selectable period back in time.
- PMEM Bandwidth Panel
- Contains a real-time display of PMem read and write rates and a graph of PMem read and write rates a selectable period back in time.
- DRAM Usage Panel
- A graph of DRAM usage on the host over a selectable time frame.
- PMEM Usage Panel
- A graph of PMem usage on the host over a selectable time frame.